
Written By: Stephanie Rojas | November 04, 2026
Time to Read 12 Minutes
A Houston rental can look profitable on paper and still fall short after expenses and financing. A real estate investment deal or no deal calculator helps you test the numbers before you commit by bringing rental income, operating costs, loan assumptions, appreciation, and return metrics into one view.
Strong rent is only part of the decision. The 50% rule estimates that operating expenses, excluding mortgage principal and interest, may take around half of a rental property’s income, so overlooked costs can change the picture.
This guide explains how calculators assess cash flow and cap rate, and how purchase price, repairs, financing, and vacancy assumptions shape the result. You’ll also learn what key metrics mean, including cash-on-cash return, debt service coverage ratio, and gross rent multiplier.
Use the calculations to compare assumptions and spot where a deal is sensitive to change. You can then make a clearer Houston investment decision based on the property’s numbers, not rent alone.
A real estate investment deal or no deal calculator organizes a property’s income, expenses, and purchase assumptions. For a Houston rental, use it to see how rent, operating costs, and financing affect projected returns.
Start with expected rent, then list other property revenue separately. A Houston property might also earn income from parking, laundry, or storage, if those features apply. Separating each source shows which revenue supports the deal and which depends on optional services. Compare expected rent with similar rental listings, not just the asking rent for one property.
Estimate cash flow by subtracting operating expenses and debt payments from rental income. The 50% rule offers a rough screen: operating expenses, excluding mortgage principal and interest, are estimated at around 50% of income. For a fuller view, cash-on-cash return divides before-tax cash flow by out-of-pocket acquisition costs, including the down payment and closing costs. Appreciation is a separate, projected source of return, not current rental income.
Compare a proposed purchase price with similar sold properties and rental listings. For an after-repair value estimate, use 3 to 5 recently sold comparable properties within 0.5 miles. Match location, property condition, and relevant features as closely as possible. Rental listings help test whether the projected rent fits the local market, while sold comparables help ground the property value assumption.
Operating expenses can include taxes, insurance, repairs, and property management. Hiring a property management company is roughly estimated to cost about 10% of rental-property income. Local property taxes change the expense estimate; landlord laws and rental regulations can affect permitted use and lease obligations. These factors can make projected income too low or costs too high. Other no-deal risks include unsupported rent assumptions, underestimated repairs, or payments that consume the available cash flow.
Free online options include rental property calculators and downloadable spreadsheet templates. They typically let you enter purchase price, rent, expenses, and financing assumptions, then estimate cash flow or returns. Before relying on a result, check which inputs the tool includes. A calculator that leaves out repairs or debt payments can make a Houston property look stronger than its full numbers support. Use consistent assumptions when comparing properties in your portfolio.
Start with net operating income, or NOI, before comparing financing options. Subtract operating expenses from property income, then divide NOI by the property’s purchase price or current market value. That ratio is the cap rate. A sample investment property with a 7% cap rate offers a quick way to compare operating performance before debt payments enter the picture. Cash flow adds financing costs, so it shows whether rental income can support both expenses and loan payments.
For a multifamily property, estimate income and expenses across the building, then review performance per unit. A strong average can hide vacant units or unusually high repair costs. For commercial property, analyze each tenant’s rent, lease term, and contribution to income. Separate shared operating expenses from property-level costs. This helps show whether one vacancy or expense change could materially affect overall cash flow.
House-flipping analysis starts with after-repair value, repair costs, other expenses, and your profit target. Rework the calculation if repair estimates or resale assumptions change.
Wholesale analysis uses a different exit strategy. Keep the assignment amount distinct from the property’s expected resale value. Each figure serves a different purpose in the transaction.
BRRRR analysis follows the buy, rehab, rent, refinance, and repeat sequence. Model purchase and renovation costs, then compare the after-repair value with potential refinance proceeds. This estimate helps assess how much invested capital might remain in the property.
Financing assumptions can change the deal’s cash flow and required capital. Hard money lenders commonly use a 60-80% loan-to-value ratio, while a typical hard money loan term is 6-12 months. A sample loan uses a 12% interest rate. Test the actual loan structure against expected holding time, renovation progress, and exit proceeds. To organize those scenarios, use this investment deal analysis tool before choosing a financing path.
A useful projection lets you adjust inputs instead of treating one estimate as certain. In Houston, changes to the purchase price, vacancy, expenses, or financing terms can shift a property’s projected profit.
A real estate pro forma projects an investment property’s future income and expenses before purchase. Build it by separating expected rent from operating costs, then accounting for vacancy and planned repairs. This shows how the assumptions produce the projected result, rather than presenting a single number without context.
Keep each input visible. For example, separate recurring maintenance from one-time renovation work, and distinguish rent collected from rent expected during vacancy. Model a conservative case alongside your main projection. A safety buffer can reduce estimated after-repair value by 5% or increase repair costs by 10%. Compare the resulting profit with your original estimate to see which assumption matters most.
Projections also help organize a portfolio. Use the same categories for each property, then adjust inputs to reflect its condition, rental plan, and location. A Houston investment with planned repairs needs different assumptions from a property ready to rent. Updating one variable at a time makes each change easier to understand.
Financing affects both the cash needed at purchase and the payments that reduce rental cash flow. Mortgage rates influence borrowing costs, while a larger down payment changes the amount financed. Closing costs increase the cash invested, and loan terms shape payment timing and the period available for repayment. Together, these inputs affect projected returns and cash-on-cash performance.
Compare financing scenarios using the same property income and expense assumptions. Change one loan input at a time, then observe its effect on payments, cash flow, and profit. This helps separate a property’s operating performance from its financing costs. Include vacancy and repair reserves in each scenario rather than assuming every month generates full rent.
Creative financing can involve different arrangements between a buyer, seller, or other funding source. Model the specific payment schedule, repayment obligations, and timing in your projection. The label alone doesn’t show whether a deal works. The actual terms determine how much cash the investor needs and whether projected income can support required payments.
For a Houston property with uncertain renovation costs, test how an increase in repairs changes the financing need and expected return. A clear pro forma connects purchase assumptions, expenses, and financing in one view. It helps reveal whether projected profit depends on a narrow set of favorable inputs or remains workable across different scenarios.
Separate income earned during ownership from value growth projected over time. For a Houston rental, compare operating cash flow, mortgage payments, and potential equity growth as distinct parts of the return.
Estimate net operating income by subtracting operating expenses from rental income, before mortgage payments. The 50% rule offers a first-pass estimate: operating expenses, excluding mortgage principal and interest, are around 50% of income. Use it to build an initial budget, then replace the estimate with property-specific expenses such as repairs, insurance, taxes, and management.
Compare that rough estimate with a detailed expense schedule. Include vacancy because an empty unit can interrupt rent while some costs continue. An expense ratio below 35% is considered good for an investment property, but the ratio depends on which expenses you include. Apply one consistent method across properties, then test whether the remaining income covers payments and reserves.
Cap rate compares net operating income with a property’s purchase price or current value. Because it excludes mortgage payments, it helps compare property operations without mixing in different loan structures. Cash-on-cash return accounts for the investor’s out-of-pocket acquisition costs, showing how before-tax cash flow relates to invested cash.
A sample rental property has a cash-on-cash return of 16.4%. Treat that result as an example, not a target for every Houston deal. Check the inputs behind the figure, including the down payment, closing costs, operating expenses, and debt payments. A change in financing can alter cash-on-cash return without changing the property’s net operating income.
Compare rental returns with appreciation by tracking current cash flow separately from projected equity growth. Assess potential tax effects separately, rather than counting them as rent or guaranteed profit. This view helps show whether a deal relies on income today, future value growth, or both.
There is no single return benchmark that fits every United States market or property. Example cap-rate ranges are 4-5% for cities such as San Diego or Austin, and 7-10% for places such as Cleveland or Indianapolis. These examples provide context, not a Houston target. Compare properties with similar locations, condition, income assumptions, and financing to make the figures useful.
For a practical review, calculate operating performance first, then add mortgage payments and appreciation assumptions. A Houston property with modest current cash flow may still build equity through value growth, while a stronger cap rate does not necessarily mean stronger after-debt cash flow. Keep each return source visible in the budget so an optimistic assumption doesn’t hide a weak result.
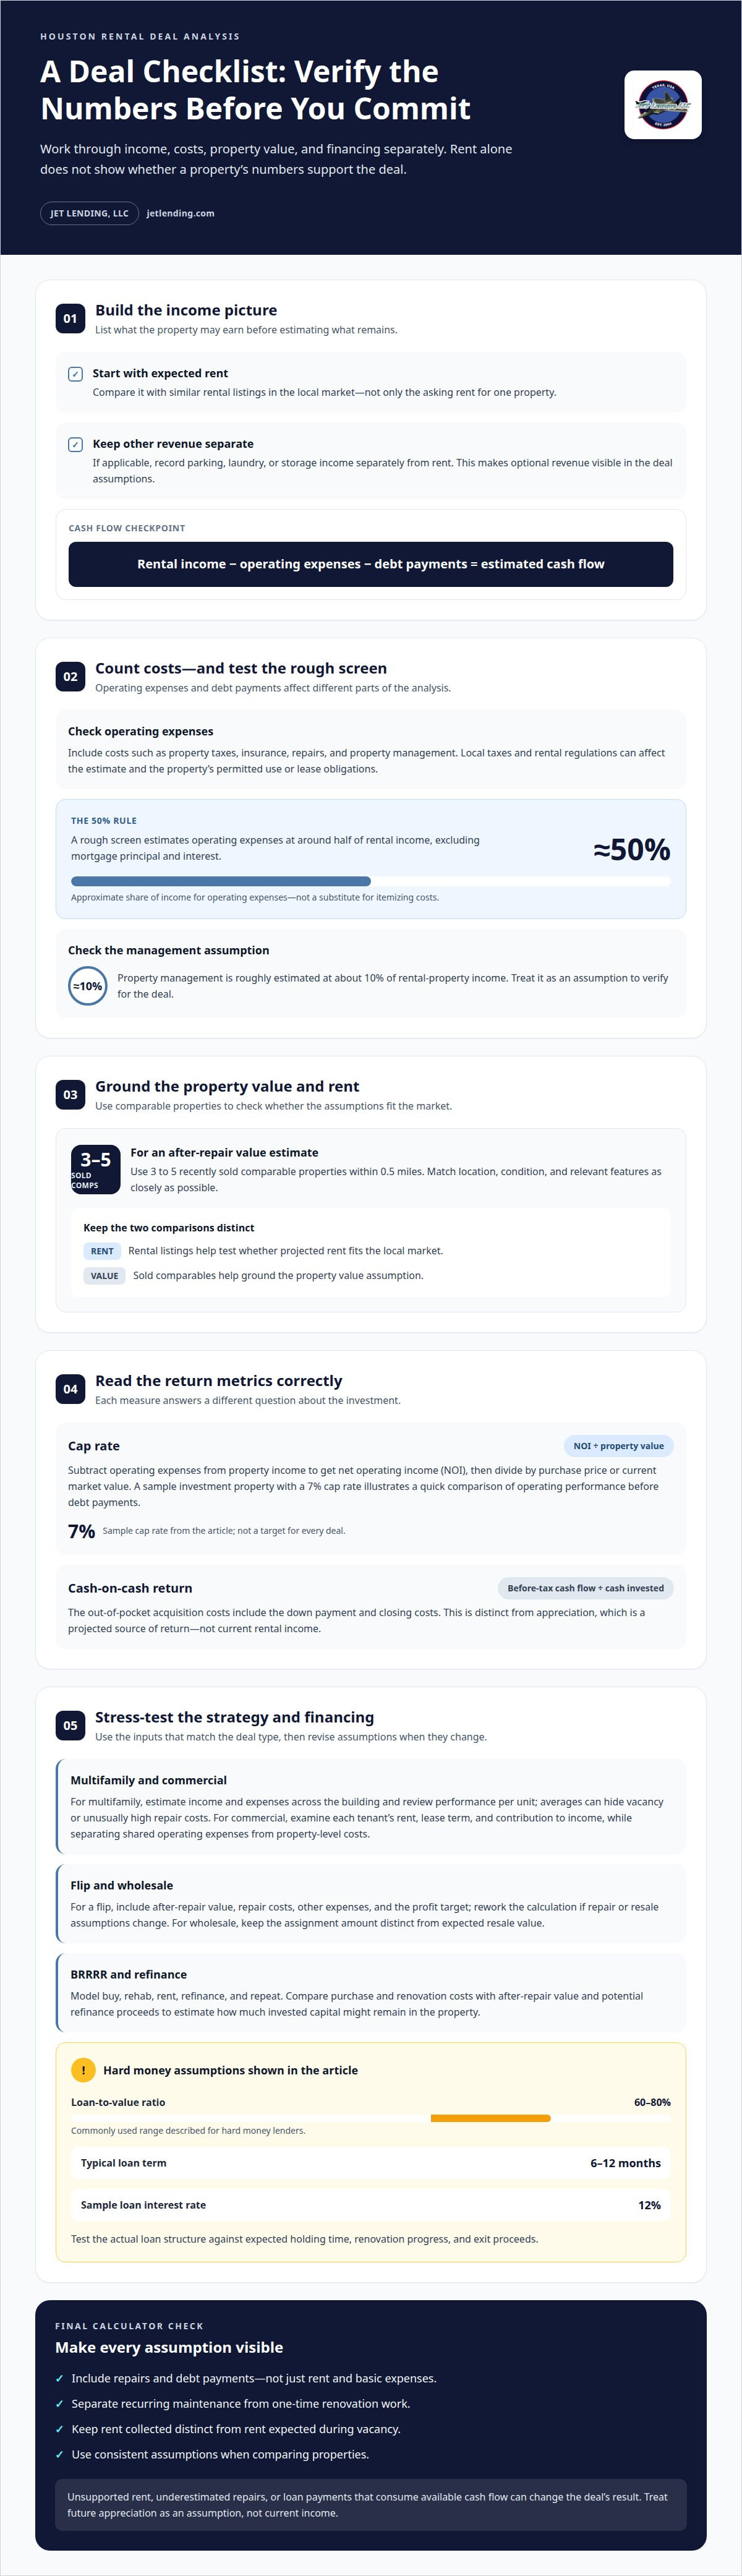
Investment metrics answer different questions about rental properties. No single figure evaluates income, financing, and capital needs all at once. Read each result alongside its formula and inputs. This makes comparisons more accurate and clarifies what a projection actually measures.
Cap rate compares a property’s net operating income with its purchase price or current market value. It focuses on operations before debt payments, so it can help compare properties with different financing. A higher cap rate does not automatically mean a stronger investment. Review the property condition, income assumptions, and expenses alongside the percentage.
Debt coverage ratio, also called debt service coverage ratio, divides net operating income by annual debt service. It shows how property income compares with required loan payments. A higher ratio is considered better because the property’s operating income covers more of its debt service. For an accurate comparison, use the same income and expense assumptions for each property.
Gross rent multiplier divides the purchase price by gross scheduled income. A lower multiplier is considered better, but this metric excludes operating expenses and financing. Use it for a quick comparison, not as a complete return estimate. If one rental property has a lower multiplier, check whether its expenses, vacancy, or condition explain the difference.
Cash-on-cash return compares before-tax cash flow with the investor’s out-of-pocket acquisition costs. It highlights the relationship between operating results and capital invested, including the down payment and closing costs. It does not measure appreciation. Owners evaluating current market opportunities should keep projected value growth separate from cash generated during ownership.
Rent-to-price rules offer another quick screen. The 1% rule suggests gross monthly rent should equal at least 1% of purchase price after repairs. Some investors use a 2% or 3% gross-monthly-rent-to-purchase-price rule instead. Treat these as screening rules, not proof of profit. They don’t account for every property’s operating expenses or debt payments.
Use metrics in sequence. First, compare operating income with property value through cap rate. Then assess whether income supports debt through the coverage ratio. Use gross rent multiplier for a quick income-to-price comparison, and cash-on-cash return to examine cash invested. Each measure answers a different question. Together, they give a clearer view than any single percentage can provide.
For a Houston investment, keep assumptions consistent when comparing properties. A lower multiplier, stronger debt coverage, or higher cash-on-cash return can each look attractive, but each reflects a different part of the deal. Review the formulas and inputs before deciding whether the numbers support your investment plan.
Jet Lending’s Investment Property Calculator helps you organize deal assumptions and evaluate an investment property’s potential. Use it when weighing rental income, expenses, financing, and projected returns before deciding how to proceed. The results can clarify which assumptions influence the deal and where a closer review may help.
If your analysis points toward an investment purchase, Jet Lending also offers Short-Term Loans for real estate investors. Consider how the loan structure fits your purchase plan and anticipated exit before moving forward. A calculator supports your decision, but it doesn’t replace your judgment about the property and its numbers.
Contact Jet Lending to discuss your investment property analysis.
A strong investment process doesn’t end when you choose a property. Record the assumptions behind each decision, then compare them with actual performance as the investment develops. This can help you spot patterns across your portfolio and refine how you assess future opportunities.
Use a real estate investment deal or no deal calculator as a decision aid, not a substitute for your investment goals. Before moving forward, consider whether the property’s projected performance fits your budget, timeline, and tolerance for risk. If financing is part of your plan, make sure the terms support how you intend to hold or exit the investment.
Every property brings a different set of trade-offs. Take the next step with a clear view of what matters to you, and keep building toward informed investment decisions.
A deal calculator helps test whether an investment property’s projected numbers align with your goals. Enter expected income, costs, and financing assumptions to see how they interact. For a Houston rental, compare a base estimate with a scenario that includes vacancy or unexpected repairs. The result supports your decision, but it doesn’t replace reviewing the assumptions behind it.
Investors evaluating a rental, renovation, or property purchase can use a deal calculator to organize assumptions before committing capital. It can also help owners compare potential acquisitions using consistent inputs. For example, an investor considering a rent-ready property and a renovation project can model each separately. This highlights differences in operating costs, financing needs, and expected income, rather than relying on purchase price alone.
A real estate investment deal or no-deal calculator estimates an investment property’s financial performance from information you provide. It organizes purchase, income, expense, and financing assumptions, then shows how changes affect projected returns. “Deal” or “no deal” is a judgment based on your criteria, not a universal result. Interpret the output alongside your plans for the property.
A real estate deal analyzer generally needs the purchase price, expected rent, operating expenses, financing terms, and anticipated holding or exit plan. Include repair needs, vacancy assumptions, insurance, taxes, and management costs where relevant. For a Houston property, distinguish recurring expenses from one-time work. Categorizing each item clearly makes it easier to identify which assumptions drive the projected outcome.
Estimate rental cash flow by subtracting operating expenses and debt payments from collected property income. To calculate cash-on-cash return, divide before-tax cash flow by out-of-pocket acquisition costs, including the down payment and closing costs. Keep the time period consistent across both figures. For practical comparisons, apply the same treatment of vacancy, repairs, and financing to every Houston property you assess.
Calculate net operating income, or NOI, by subtracting operating expenses from property income before debt service. Divide NOI by the purchase price or current market value to estimate cap rate. Calculate debt service coverage ratio by dividing NOI by annual debt service. These metrics answer different questions: cap rate measures operating return against value, while coverage compares income available with scheduled debt payments.
Build estimates from property-specific information, keeping each category separate in your analysis. Use comparable rental listings to inform expected rent, and account for vacancy as time without collected rent. Review the property’s condition for repair needs, and include taxes, insurance, and management among operating costs. For Houston rentals, update assumptions when the property details or local operating conditions differ from those of your comparison properties.
Tags:

What if a flip looks profitable on paper but still leaves you short on cash at closing? A Houston fix and flip budget template should do more than total purchase and repair costs. Property condition,...

A strong first-year return can still hide a weak long-term deal. Use a real estate investment deal analysis spreadsheet to compare scenarios and calculate cash-on-cash return, NOI, cap rate, DSCR,...

A promising Houston deal can change quickly when a rehab runs late, holding costs rise, or the exit takes longer than planned. That’s why Houston real estate investment case studies should show more...