
Written By: Stephanie Rojas | October 30, 2026
Time to Read 13 Minutes
A strong first-year return can still hide a weak long-term deal. Use a real estate investment deal analysis spreadsheet to compare scenarios and calculate cash-on-cash return, NOI, cap rate, DSCR, and debt payments. Then test how changes in rent, financing, expenses, and holding time affect projected cash flow.
It’s tempting to judge a property by a single return figure. But that number tells only part of the story: the assumptions behind it and the years that follow matter, too.
This guide shows you how to build a clear deal comparison, from entering purchase and operating assumptions to checking financing metrics and long-term projections. See how the calculations connect, where a scenario may become less resilient, and how to assess the results before making an investment decision.
Yes, one spreadsheet can screen different rental property types if you use consistent formulas and adjust the inputs for each property. Separate rent, expenses, unit details, and financing so you can compare deals without mixing assumptions.
Free spreadsheet templates can offer a useful starting structure for rental analysis. Review the formulas and input categories, then tailor them to the property and Houston market you’re evaluating.
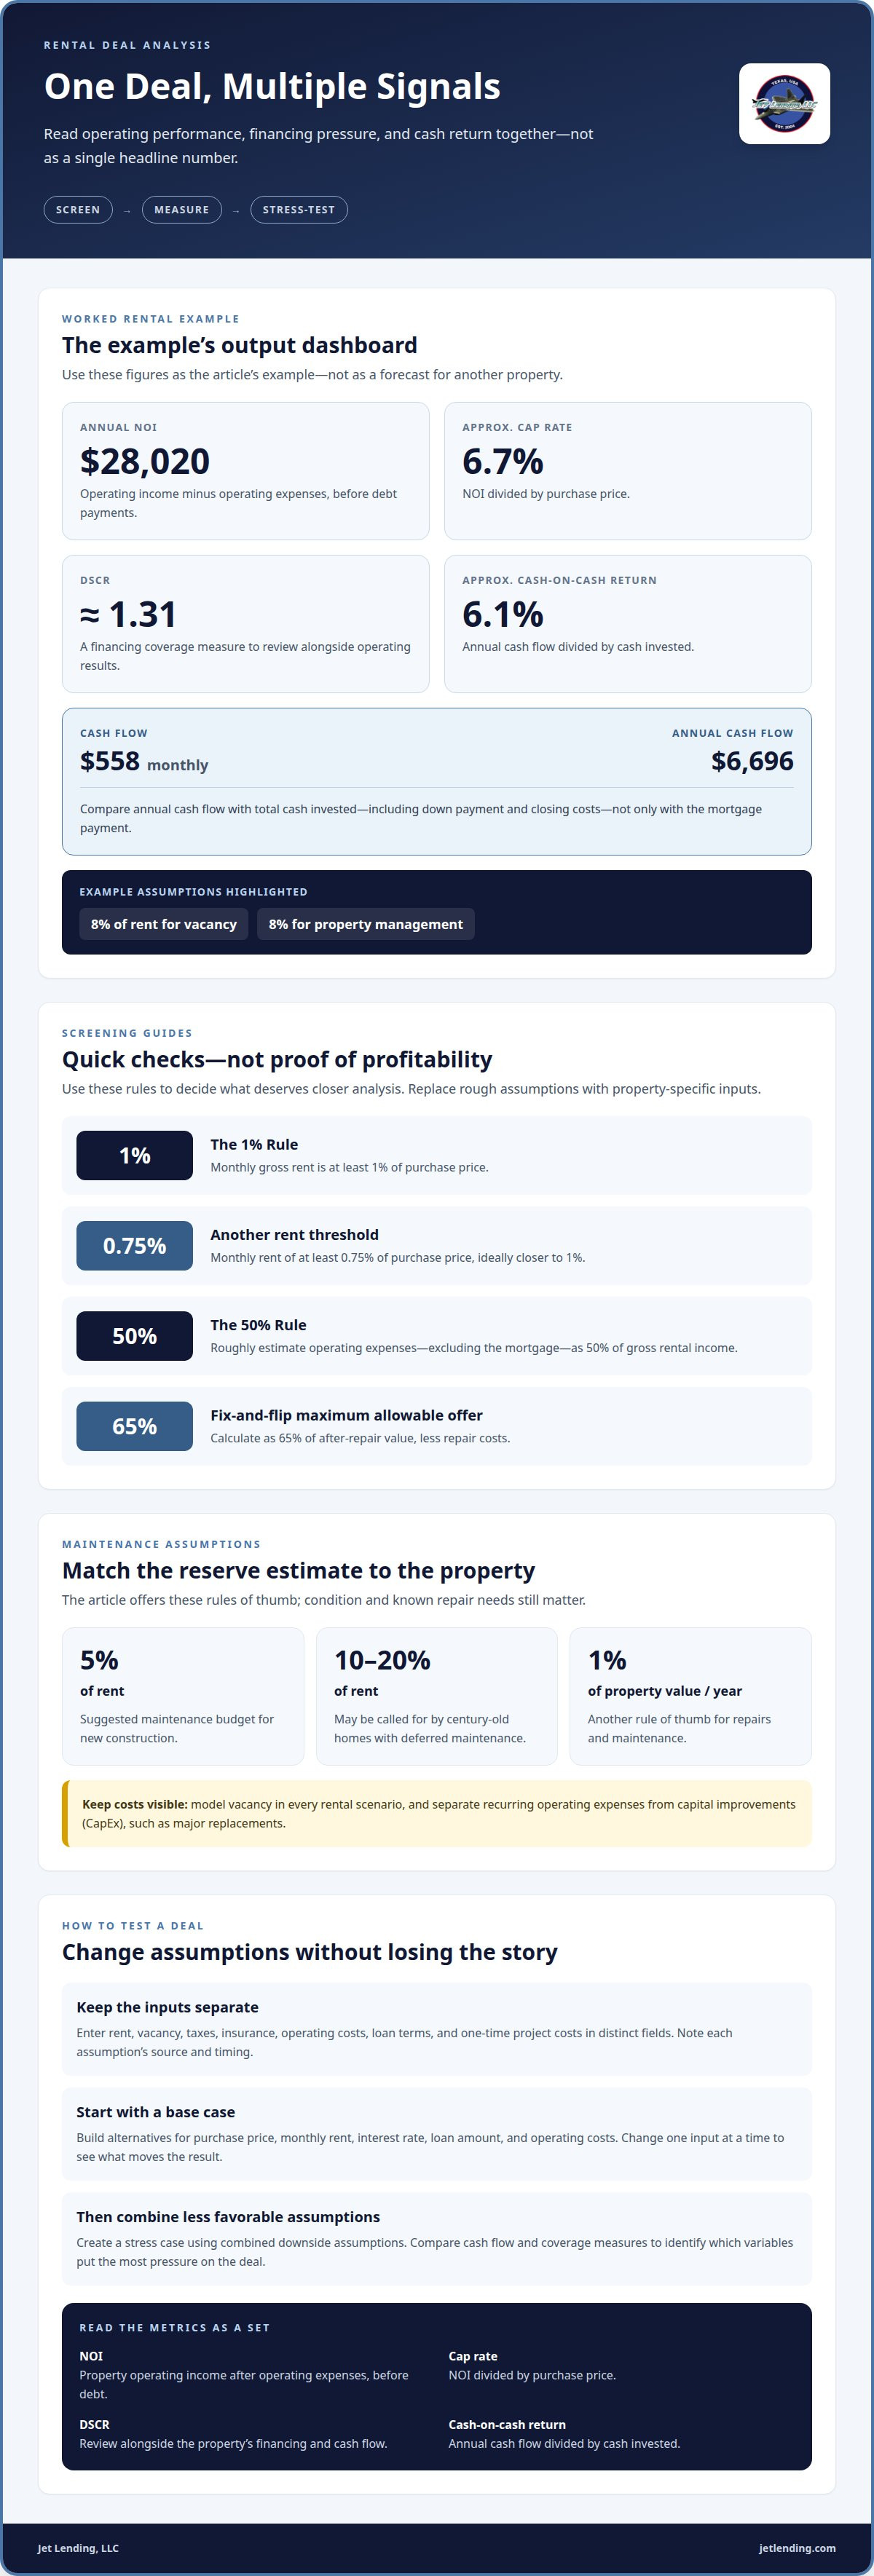
Start with monthly rent and purchase price as an initial screen. The 1% Rule is a guideline under which monthly gross rent is at least 1% of purchase price. Another screening threshold is monthly rent of at least 0.75% of purchase price, ideally closer to 1%. Use these rules to decide what deserves closer analysis, not as proof of profitability.
Next, enter expected income and operating costs. List vacancy, management, maintenance, taxes, and insurance separately. Calculate NOI by subtracting operating expenses from operating income, before debt payments. Then calculate cap rate as NOI divided by purchase price, and cash-on-cash return as annual cash flow divided by cash invested.
Apply the same framework to single-family and multifamily properties. For a single-family rental, enter property-level rent and expenses. For multifamily, record rent and vacancy by unit before totaling the figures. This shows how a vacant unit affects income while keeping formulas consistent across property types.
Use this worked rental example to see how the inputs connect. The example includes 8% of rent for vacancy and 8% for property management.
Review the outputs together. The example produces about $28,020 in annual NOI, an approximate 6.7% cap rate, and a DSCR of about 1.31. Monthly cash flow is $558, or $6,696 annually, with an approximate 6.1% cash-on-cash return.
Check how the down payment and closing costs affect cash invested before interpreting the cash-on-cash result. The example’s $6,696 annual cash flow should be compared with the total cash invested, not just the mortgage payment. For a Houston property, replace example assumptions with property-specific inputs before using the results to guide a decision.
Build a base case, then vary one assumption at a time. Keep income, operating costs, financing, and one-time project costs separate so you can see what drives each result.
For the Houston property, start with supportable assumptions for rent, property taxes, insurance, operating expenses, and loan terms. Put each assumption in its own cell and note its source and timing. This makes it easier to update a tax estimate or insurance quote without changing unrelated inputs.
For a fix-and-flip, model renovation costs as individual work items, then estimate resale value using comparable properties and the planned finished condition. Calculate a maximum allowable offer as 65% of after-repair value, less repair costs. Keep purchase, renovation, and resale assumptions distinct so a change in scope doesn’t disappear inside one total.
Create a base case and alternatives for purchase price, monthly rent, interest rate, loan amount, and operating costs. First, change one input at a time; then combine less favorable assumptions in a stress case. Compare cash flow and coverage measures to identify which variable has the greatest effect on the deal.
Use the 50% Rule as a rough screening estimate: operating expenses, excluding the mortgage, equal roughly 50% of gross rental income. It isn’t a substitute for property-specific inputs. Test a lower rent, higher expenses, or different financing terms separately to show how sensitive the projected result is.
Include vacancy in every rental scenario; avoid a 0% assumption. Vacancy reduces collected rent while taxes, insurance, and some maintenance costs continue. Separate recurring operating expenses from capital improvements, or CapEx, such as major replacements, so the monthly operating picture doesn’t hide larger future outlays.
Set repairs using the property’s condition. One suggested maintenance budget is 5% of rent for new construction; century-old homes with deferred maintenance may call for 10% to 20%. Another rule of thumb is 1% of property value each year for repairs and maintenance. Test the estimate against the building’s age and known needs.
For U.S. closing costs, property taxes, insurance, and maintenance, use inputs that reflect the property’s location, condition, transaction, and coverage. No single national figure applies to every deal. In Houston, keep each category separate and test how an increase affects cash invested and projected cash flow.
Include tax and legal assumptions as explicit deal inputs, such as applicable property charges, transaction costs, and the ownership structure used in your analysis. Don’t treat a spreadsheet estimate as tax or legal advice. For a project-level view, the Investment Property Calculator can help organize investment assumptions.
Calculate each metric from clearly labeled inputs, then compare what each reveals about the same Houston rental deal. Together, they show operating performance, financing pressure, and the cash return on invested funds.
Start with collected rental income, subtract operating expenses, then subtract scheduled debt payments to estimate pre-tax cash flow. Keep operating expenses separate from mortgage principal and interest. This keeps NOI as a property-level measure, while cash flow reflects the effect of financing.
To estimate break-even occupancy, divide the rent needed to cover modeled operating costs and debt service by potential rent at full occupancy. For example, if required annual income is A and full-occupancy rent is B, break-even occupancy is A divided by B. Express the result as a share of potential rent.
This calculation depends on realistic rent and expense inputs for the property. Some expenses continue even when a unit is vacant, so don’t reduce every cost in proportion to occupancy. For a Houston rental, make assumptions property-specific and identify which costs remain fixed as occupancy changes.
Keep break-even occupancy distinct from cash flow. It estimates the rental income needed to cover modeled costs, while cash flow shows the projected amount left after expenses and debt service. Test both measures under lower-rent or higher-cost scenarios.
Calculate NOI by subtracting operating expenses from operating income, before debt payments. Divide NOI by purchase price to calculate cap rate. This compares property-level operating income with the property’s price, without letting the loan structure change the result.
Calculate DSCR by dividing NOI by annual debt service. A ratio above 1 means modeled NOI exceeds scheduled debt payments; below 1 means NOI falls short. Use the result to see how much operating income supports the debt, then review the income and payment assumptions behind it.
For cash-on-cash return, divide annual pre-tax cash flow by total cash invested. Include the cash required for acquisition and transaction costs in the denominator. Keep the time periods consistent: divide annual cash flow by total cash invested, not monthly cash flow.
Read the measures together. Cap rate focuses on operating income relative to price; DSCR focuses on NOI relative to debt payments; cash-on-cash return compares cash earnings with cash invested. A financing change may affect DSCR and cash-on-cash return without changing NOI. Before comparing Houston deals, recheck each formula’s inputs and trace unexpected results back to their assumptions.
Model the loan payment schedule alongside property income. This shows how interest, principal repayment, loan structure, and debt coverage shape a deal over time.
Use the actual loan structure in your assumptions. A 30-year term is a typical investment-property loan term, but the modeled term should match the financing scenario you’re evaluating. Compare different rates or terms by recalculating scheduled payments, total interest, principal reduction, and cash flow. Keep the property’s operating performance separate from the loan schedule.
Test coverage under a lower-income or higher-payment case. If projected NOI falls while debt service stays fixed, DSCR declines. If the result approaches 1.20, identify whether rent, vacancy, operating expenses, or loan terms are driving the change. This makes the ratio useful as a sensitivity measure, not just a single summary figure.
Record lien amounts independently. The example spreadsheet lists the first mortgage or lien amount as 65% and the miscellaneous mortgage or lien amount as 15%. Keeping both fields visible helps you see how each financing source contributes to the total debt. Check that the combined loan amounts, payment calculations, and cash invested use consistent assumptions.
Label each scenario clearly, such as base financing and alternate financing. Reconcile the payment schedule with annual debt service before using it in coverage calculations. Then verify that cash flow subtracts debt payments once, while NOI remains before debt service. These separate calculations prevent financing costs from distorting property-level performance.
Project each year separately, then compare the full holding period with the first-year snapshot. A spreadsheet can model projections for up to 30 years and let you enter estimated holding time in months.
Use a consistent period in every row. Monthly inputs should roll up into annual totals without mixing monthly rent with annual expenses. This simple structure helps you spot formulas that stop too early or extend beyond the planned sale.
Keep operating performance distinct from debt payments. Calculate NOI as operating income less operating expenses, then subtract debt service to derive cash flow. Carry each result forward year by year rather than copying the first-year figure across the full projection.
Separate recurring repairs from major replacements. A roof or building-system replacement can have a different cash impact from regular upkeep. Enter the expected timing and cost as distinct assumptions, then identify which forecast periods include the added expense.
Keep interest, principal, and remaining balance identifiable. If you test another loan term or interest assumption, update the schedule and linked cash-flow calculations together. Don’t let a changed payment sit alongside an outdated debt balance.
Review the complete forecast alongside the shorter-term view. A long projection helps reveal when repairs, debt payments, or operating changes may affect returns. Treat it as a decision tool, with every assumption editable and traceable.
Jet Lending offers Short-Term Loans for real estate investors evaluating an investment deal. Once your spreadsheet shows how purchase assumptions, operating costs, and projected returns fit together, financing is a natural next consideration for an investment property.
Use Jet Lending’s Investment Property Calculator to organize deal assumptions and compare potential scenarios. It can help you review the numbers before deciding whether a short-term loan fits your investment plan. Keep projected cash flow, renovation needs, and your intended holding period in view as you assess the deal.
Explore Jet Lending’s investment tools and Short-Term Loans, or visit jetlending.com to learn more.
A useful model does more than produce a return figure. It helps you identify which assumptions need attention before you commit to a property. Use your real estate investment deal analysis spreadsheet to record the reasoning behind each key input, then revisit those assumptions as the deal develops. This creates a clearer path from initial screening to a confident investment decision.
Before moving forward, identify the scenario that best reflects your plan and the trade-offs you’re prepared to accept. If financing is your next decision, discuss the property and your investment goals with Jet Lending. Its options for real estate investors and Investment Property Calculator can support your deal analysis.
Keep asking clear questions of the numbers, and take the next step with purpose.
A good cash-on-cash return depends on your investment goals, risk tolerance, and how you finance the property. Compare deals using the same assumptions, including cash invested, operating costs, and debt payments. Then test whether the return still fits your plan if rental income falls or expenses rise. For a Houston property, local rent potential, property condition, and ongoing costs all shape the result, so no single benchmark suits every deal.
Update your analysis whenever a key assumption changes, such as offer price, expected rent, loan terms, renovation scope, or operating costs. Before making an offer, refresh the inputs with the latest deal information. After acquisition, compare actual income and expenses with projections as records become available. This creates a useful feedback loop: see where estimates differ from operations and refine assumptions for future Houston investment properties.
A real estate deal analysis spreadsheet organizes a property’s purchase, income, expenses, financing, and projected performance in one model. It connects those assumptions to calculations, helping investors compare opportunities consistently. A real estate investment deal analysis spreadsheet also makes the reasoning behind an estimate visible, rather than leaving a result unexplained. Use it to support decisions, not as a substitute for reviewing the property and its underlying information.
Include purchase and closing assumptions, expected rental income, vacancy, operating expenses, financing terms, and cash invested. Add formulas for cash flow, NOI, cap rate, DSCR, and cash-on-cash return. A practical model also separates recurring maintenance from larger capital improvements and tracks the loan balance across the planned holding period. For Houston, keep property-specific taxes, insurance, and rent assumptions distinct so you can update them without altering unrelated inputs.
Use formulas that connect the inputs to decision metrics: NOI equals operating income less operating expenses; cap rate equals NOI divided by purchase price; DSCR equals NOI divided by annual debt service. Calculate cash flow after debt service, then divide annual cash flow by total cash invested for cash-on-cash return. Label each formula’s inputs, and make sure debt payments aren’t deducted when calculating NOI.
Calculate cash-on-cash return by dividing annual pre-tax cash flow by the cash invested in the deal. Calculate cap rate by dividing NOI by the property’s purchase price. ROI compares investment gains with the amount invested, so define which gains and costs your model includes, such as interim cash flow and sale proceeds. Keep these measures separate: each answers a different question about operating performance, invested cash, or total investment results.
Estimate rent using comparable properties with similar locations, layouts, and condition, then enter expected rent separately for each unit in a multifamily analysis. Model vacancy as a reduction in potential rental income instead of assuming every unit stays occupied. List operating expenses by category, including management, taxes, insurance, and maintenance. For a Houston deal, use assumptions that reflect the specific property and neighborhood, then test how lower rent or higher costs change the forecast.
Enter the loan amount, interest rate, and term as separate assumptions, then use an amortization schedule to calculate payments and track the remaining balance. Show principal and interest distinctly, and connect annual debt service to cash flow and DSCR calculations. Compare financing scenarios while keeping property assumptions constant. This helps isolate how a changed loan term or rate affects payments, debt coverage, and cash available from the investment.
Tags:

Owning property in Texas and qualifying for a loan are separate matters. Property ownership generally does not depend on immigration status, so DACA recipients can own property. A real estate...

What if you could make a strong Houston offer without waiting for a bank’s full approval process? For investors competing with cash buyers, bridge loans for real estate investors Houston can provide...

What if the funding partner that looks fastest on paper can’t keep pace with your property, rehabilitation scope, or exit plan? For Houston investors searching for reliable funding for real estate...