
Written By: Stephanie Rojas | November 13, 2026
Time to Read 12 Minutes
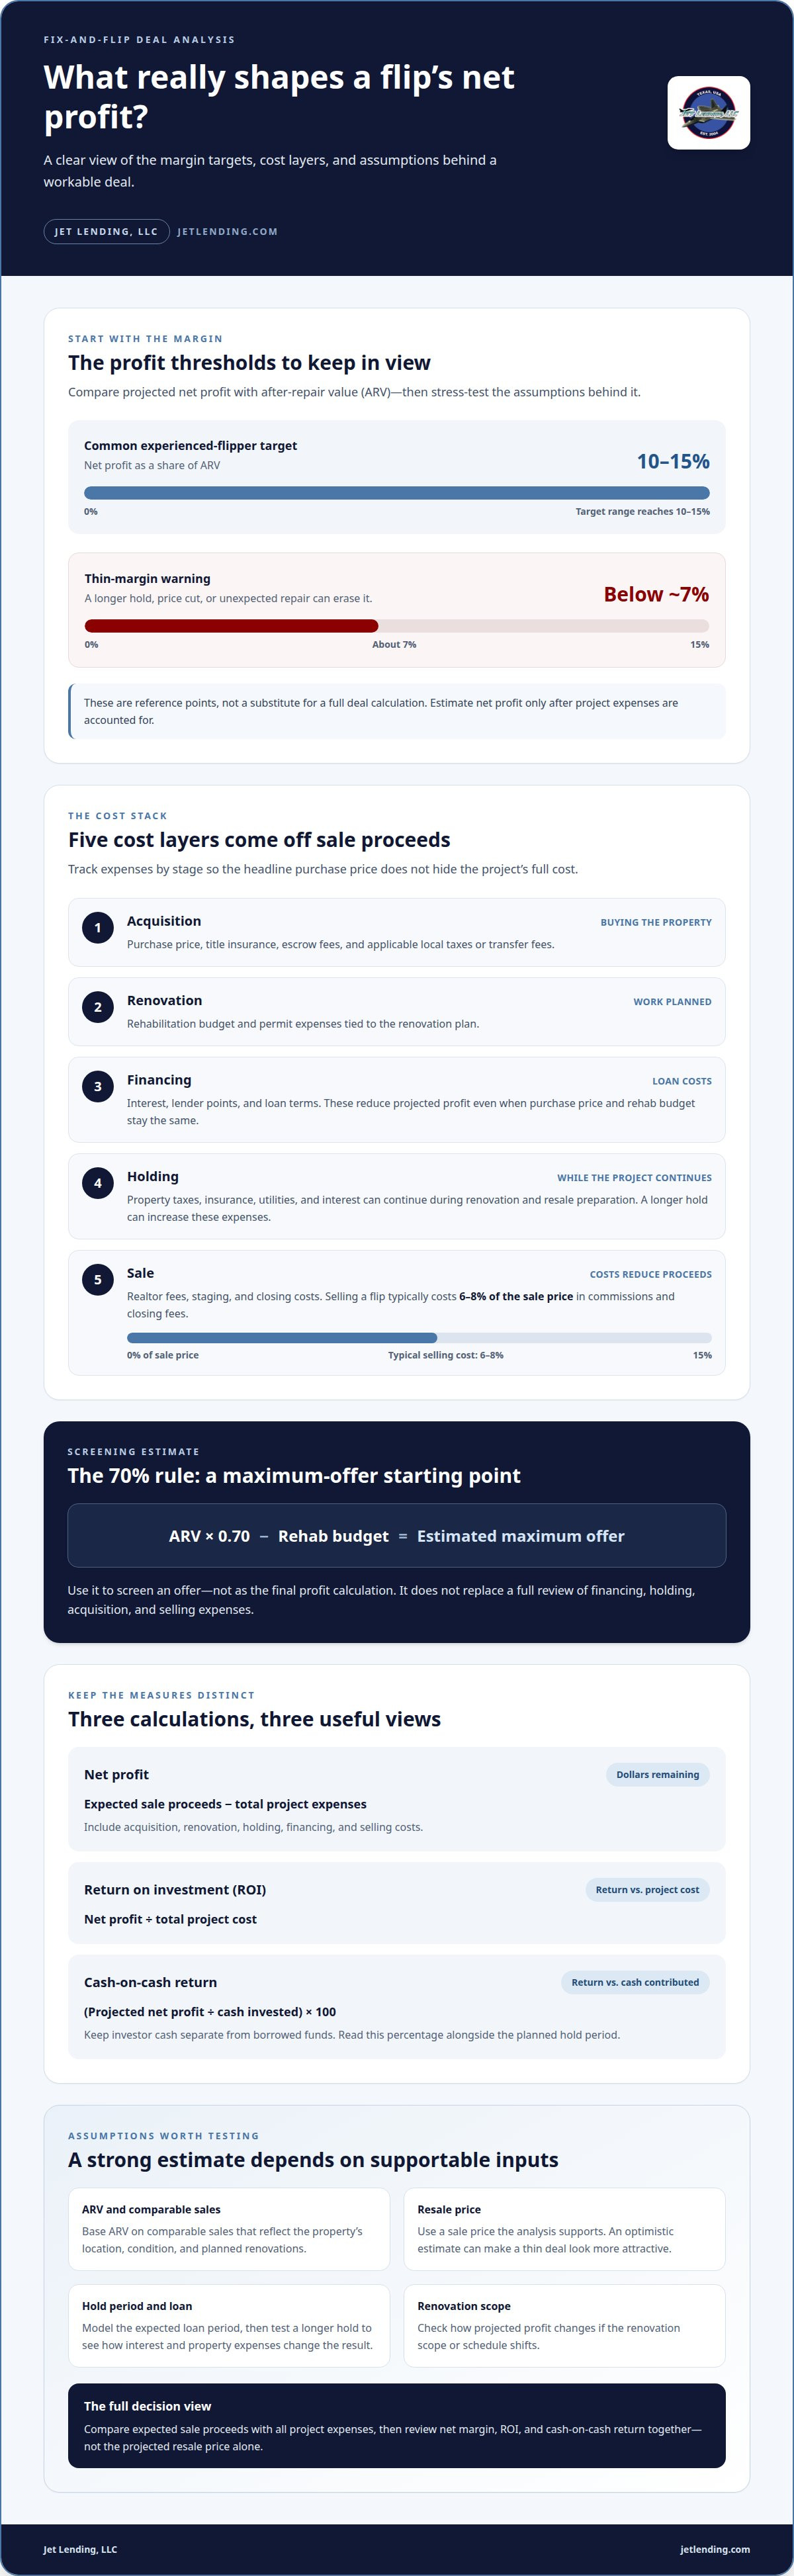
A projected profit margin can look healthy until financing and selling costs come off the top. Experienced flippers commonly target a net profit of at least 10-15% of after-repair value (ARV), while a margin below about 7% can be erased by a longer hold, a price cut, or an unexpected repair. A real estate deal analysis calculator for flips helps bring those costs into the same decision before you make an offer.
The purchase price matters, but it is only part of the picture. Loan costs, interest, and lender points also shape how much cash a deal needs and what return may remain when the property sells. A well-supported after-repair value (ARV) and realistic comparable sales matter too: an optimistic resale estimate can make a thin deal appear more attractive than it is.
This guide shows how to assess profit margin, acquisition and holding costs, financing, comparable sales, and ARV in one analysis. You’ll learn how to interpret projected returns, identify the assumptions with the greatest impact, and decide whether a flip’s numbers leave enough room for the work and risk involved.
Experienced flippers commonly target net profit of at least 10-15% of after-repair value (ARV). The 70% rule estimates a maximum offer by multiplying ARV by 70% and subtracting rehabilitation costs.
Estimate net profit by subtracting total project expenses from expected sale proceeds. Divide that profit by total project cost to calculate return on investment (ROI). Keep appreciation separate from renovation gains: a higher market value may increase projected proceeds, but the estimate should reflect the sale price your analysis supports.
That is below the 10-15% target experienced flippers commonly use. A margin below about 7% can be erased by a longer hold, a price cut, or an unexpected repair. A real estate deal analysis calculator for flips helps organize those assumptions so you can see how each affects the projected result.
Compare the projected margin with the risks in your specific plan. If the estimate depends on a higher resale value or a tight renovation schedule, test how profit changes when either assumption shifts. This makes the projected return more useful than a single best-case figure.
Cash-on-cash return compares projected cash profit with the investor’s cash contribution. Divide projected net profit by cash invested, then multiply by 100. These measures reflect different time perspectives, so read them with the planned hold period.
Financing affects both cash invested and total expenses. Borrowed funds may reduce your upfront contribution, while interest and lender points reduce net profit. Use a real estate deal analysis calculator for flips to model these figures together, rather than treating them as separate signs of deal strength. This gives you a clearer basis for comparing opportunities across a portfolio.
Apply the 70% rule by multiplying ARV by 0.70, then subtracting the rehabilitation budget. Use this as a screening estimate, not as the final profit calculation; it doesn’t replace a full review of financing, holding, acquisition, and selling expenses.
Share the assumptions behind your offer with lenders and partners. Include estimated ARV, rehab budget, projected costs, cash required, and net profit. A clear investment report shows what drives the return and how changes in resale value or renovation scope could affect the decision. Keep the assumptions consistent across your report and calculator.
A flip analysis should combine the purchase price with acquisition, financing, holding, renovation, and selling costs. Include local property taxes, permit costs, and transfer fees where they apply. Each one affects the amount left for profit.
Useful calculator inputs include purchase price, closing costs, rehab budget, ARV, loan terms, interest, lender points, holding time, monthly expenses, and selling costs. Financing costs and holding time affect returns because interest and property expenses continue while the project remains unsold.
Start with the agreed purchase price, then add buying costs such as title insurance and escrow fees. Keep these amounts separate so you can see the full acquisition cost instead of judging the offer by its headline price alone.
Include local taxes, permits, and transfer fees when they apply. Property taxes add to carrying costs during the hold, while permit expenses are tied to the renovation plan. Record each cost in the right category: acquisition charges and project expenses arise at different stages.
Enter the loan’s interest rate, terms, lender points, and expected holding period. These costs reduce projected profit even when the purchase price and renovation budget stay the same. Model the expected loan period, then test a longer hold to see how additional interest changes the result.
Monthly holding costs matter too. Property taxes, insurance, and utilities can continue throughout renovation and resale preparation. A longer timeline can increase those expenses alongside interest, tightening the margin before the property reaches the market.
Plan selling expenses before deciding whether the projected return is workable. Realtor fees, staging, and closing costs can all reduce sale proceeds; selling a flip typically costs 6-8% of its sale price in commissions and closing fees.
For a clear analysis, enter costs by stage: acquisition, renovation, financing, holding, and sale. Then compare the total with expected sale proceeds. This helps you identify whether purchase price, loan interest, or timing is driving a change in projected profit. Update the relevant inputs when project timing or financing assumptions shift.
Cash-on-cash return shows how projected cash profit compares with the investor’s cash contribution. For a flip, calculate it by dividing projected net profit by cash invested, then multiplying by 100. This gives a percentage tied to the actual cash committed, rather than the property’s full purchase price or total project cost.
Use consistent inputs. Subtract acquisition, renovation, financing, holding, and selling costs from expected sale proceeds to estimate net profit. Then divide by the cash you contribute. Include closing costs and loan charges in the project calculation, but don’t count borrowed funds as investor cash. An accurate result depends on keeping those figures separate.
For example, a loan can reduce the cash needed upfront while adding interest and lender points to total costs. If projected profit stays unchanged, this may increase calculated cash-on-cash return, but the added financing costs also reduce profit. Compare both sides instead of assuming that a smaller upfront contribution automatically makes a deal stronger.
Profit margin and ROI answer related but different questions. Profit margin compares net profit with a chosen value, such as ARV. Cash-on-cash return compares that profit with investor cash. State the denominator for each calculation so partners can understand why two percentages differ for the same project.
Annualized return expresses a project’s return on an annual basis, which helps compare flips with different timelines. A shorter and a longer hold can produce different annualized results, even when projected total profit is similar. Include the expected project duration alongside the result: it adds essential context without changing the underlying profit estimate.
Internal rate of return (IRR) expresses the annual rate earned on invested dollars over the time they remain invested. Unlike a simple cash-on-cash calculation, IRR accounts for when cash flows occur. Record when money goes into acquisition and renovation, then when sale proceeds return to investors. Those dates affect the IRR calculation.
Use three checks before sharing the numbers:
These checks make the calculation easier to interpret. If a repair delay shifts the sale date, update cash-flow timing and holding expenses before comparing returns. Showing net profit, cash-on-cash return, and IRR together gives lenders and partners a clearer view of projected profit and the time required to earn it.
After-repair value (ARV) estimates what a property may be worth after renovations. Comparable sales help ground that estimate in completed transactions for similar properties.
Choose sold properties with relevant similarities, including location, size, layout, and condition. Compare each sale with the subject property and planned improvements, not just its asking price. A renovated home and an unrepaired home provide different evidence for the finished property’s value.
Record why each comparable supports your estimate. If a sale differs in condition or layout, account for that difference rather than treating its price as a direct match. A small set of relevant sales can provide a stronger basis than unrelated properties that happen to be nearby.
To estimate ARV, use comparable sales of similar, improved properties to assess market value after renovations. Then use that ARV as the projected sale value in your flip analysis. For example, if your planned repair level does not match a comparable’s condition, that sale may not support the same estimate.
Keep the ARV assumption visible beside projected costs and profit. A higher estimate can increase projected income on paper, while a lower one reduces expected sale proceeds. Test both to see how sensitive the deal is to its resale value.
Build the rehab budget from the actual scope of work. Include materials, labor, permits, and inspections, and connect each cost to a planned repair. This helps identify omitted work and shows how a change in scope affects total project expenses.
Use the ARV and full cost estimate to calculate projected net profit and ROI. Subtract acquisition, repair, financing, holding, and selling expenses from expected sale proceeds. Compare the result with project cost, and note which comparable sales support the resale assumption. This ties the profit estimate to evidence rather than leaving it as a standalone figure.
To estimate after-tax income, subtract the tax amount used in the investor’s financial plan from projected net profit. Keep this figure separate from pre-tax profit so lenders or partners can distinguish project costs from the investor’s tax planning. Use the same sale proceeds and expense assumptions as in the rest of the analysis.
Update the analysis whenever the repair scope or comparable evidence changes. If you remove a planned renovation, revise the rehab budget and reconsider whether the same completed sales still support the ARV. This keeps profit and ROI estimates aligned with the property’s actual plan.
Loan-to-cost (LTC) compares the loan amount with total project cost, which can include acquisition, renovation, and other project expenses. A higher or lower LTC changes how much cash the investor contributes, but does not show the full financing picture. Interest, lender points, and holding time also affect projected profit.
Calculate LTC by dividing the loan amount by total project cost. Keep the loan amount separate from investor cash, then consider how each affects the deal. Treat points as a financing expense in the project analysis rather than overlooking them when estimating net proceeds from a sale.
Interest adds cost for each period the loan remains outstanding. The expected holding period therefore links financing assumptions to renovation progress and sale timing. Model the planned duration, then consider how a longer hold affects interest and other carrying expenses. Property taxes, insurance, and utilities can continue during that period, reducing the cash left after closing.
Separate one-time financing expenses from costs that accumulate over time. Lender points affect the project near the start of financing, while interest changes with the loan balance, rate, and time outstanding. Record each input in its own category to see whether financing terms or an extended hold has the larger effect on projected profit.
Review the analysis if your exit plan changes from selling to keeping the property as a rental. A flip calculation focuses on sale proceeds and project costs. A rental analysis instead depends on ongoing income and operating expenses, along with debt service; collaborating with real estate and management specialists such as Morgan Property Solutions Inc. can provide valuable insight into realistic local operating costs and leasing rates. Mixing these assumptions can make the projected return difficult to interpret.
Before comparing financing scenarios, keep these inputs distinct:
Change one financing assumption at a time, then compare the resulting project cost and profit. If the hold extends, update interest and carrying expenses together. If the loan amount changes, recalculate LTC and investor cash. This helps lenders and partners see which terms drive the projected outcome.
Jet Lending, LLC’s Investment Property Calculator helps investors bring flip assumptions together for deal analysis. Use it to review how purchase, renovation, financing, holding, and resale estimates affect a property’s projected return. It’s a practical next step once you’ve gathered comparable sales and want to assess the numbers as a complete deal.
For investment projects where short-term financing is part of the plan, consider how loan terms and interest fit the same analysis. A calculator can support your evaluation, while the final decision depends on the assumptions and costs entered.
Contact Jet Lending, LLC to discuss your investment property needs.
A real estate deal analysis calculator for flips is most useful before you commit and whenever the plan changes. Treat projections as working assumptions, and update them when renovation scope, timing, financing, or expected resale conditions shift. This helps you spot a narrowing margin early and decide whether to adjust the offer, revise the plan, or move on.
Build a repeatable process for each property. Keep assumptions visible, record why they change, and compare the revised outlook with your investment goals. Over time, this record can help you identify which projects fit your approach and where your estimates need more care. A measured decision is progress, even when it means passing on a deal.
Refine your process with each informed decision. A well-tested analysis gives you a steadier starting point for the next opportunity.
Hard-money financing adds interest and lender points to project expenses, while changing how much cash you contribute upfront. Model the loan amount, terms, points, and expected payoff timing separately. For a Houston flip, compare the financed scenario with a cash purchase using the same repair scope and resale assumptions. This shows whether reduced upfront cash offsets added financing costs.
There is no single cost for every flip: the total depends on the property and planned work. Estimate acquisition and closing costs, materials, labor, permits, inspections, financing, holding, and resale expenses. For example, a Houston property needing structural work has a different budget from one requiring cosmetic updates. Use the scope of work and financing timeline to prepare a project-specific estimate before deciding on an offer.
First-time flippers can overlook expenses that continue after renovation. Check property taxes, insurance, utilities, inspection and permit costs, loan interest, lender points, and sale preparation expenses. Review the project in stages: purchase, renovation, holding, and resale. For a Houston property, give each local charge its own budget line instead of burying it in a general contingency.
Estimate renovation costs by turning the planned work into a written scope, then assigning costs to materials and labor. Include permits and inspections where they apply. Separate major tasks, such as kitchen work or roof repairs, from finish items so you can revise one area without rebuilding the entire budget. For a Houston house, tie each estimate to its condition and the improvements needed to support the intended resale value.
Costs vary by transaction and property, so estimate buying and selling expenses separately. Acquisition costs may include title insurance and escrow fees. Selling costs can include realtor fees, staging, and closing costs. Include relevant transfer fees in the project budget too. Keeping these items distinct prevents purchase charges from being confused with sale expenses and makes projected proceeds easier to interpret.
Gross profit is the expected sale price minus the purchase price and renovation costs. Net profit also subtracts financing, holding, acquisition, and selling costs. To estimate ROI, divide net profit by total project cost. Use consistent definitions across your Houston deal comparisons: changing what counts as project cost can make two ROI figures appear comparable when they are not.
Give contingency its own budget line rather than folding it into routine renovation costs. Base the allowance on the property’s known condition, inspection findings, and uncertainty in the planned work; don’t treat it as profit. If an unexpected repair comes up, update the task cost and timeline, then recalculate financing and holding expenses. This shows how the issue affects the project instead of hiding its impact in a single total.
Tags:

A Houston flip can spend no more than $700,000 in total under the 70% rule when its after-repair value is $1 million. If repairs are budgeted at $50,000, that puts the purchase price at no more than...

What if the financing that gets you the keys leaves too little cash to finish the renovation? Learning how to finance a house flip in Houston means looking beyond the purchase price. Rehab costs,...

A Houston rental can look profitable on paper and still fall short after expenses and financing. A real estate investment deal or no deal calculator helps you test the numbers before you commit by...